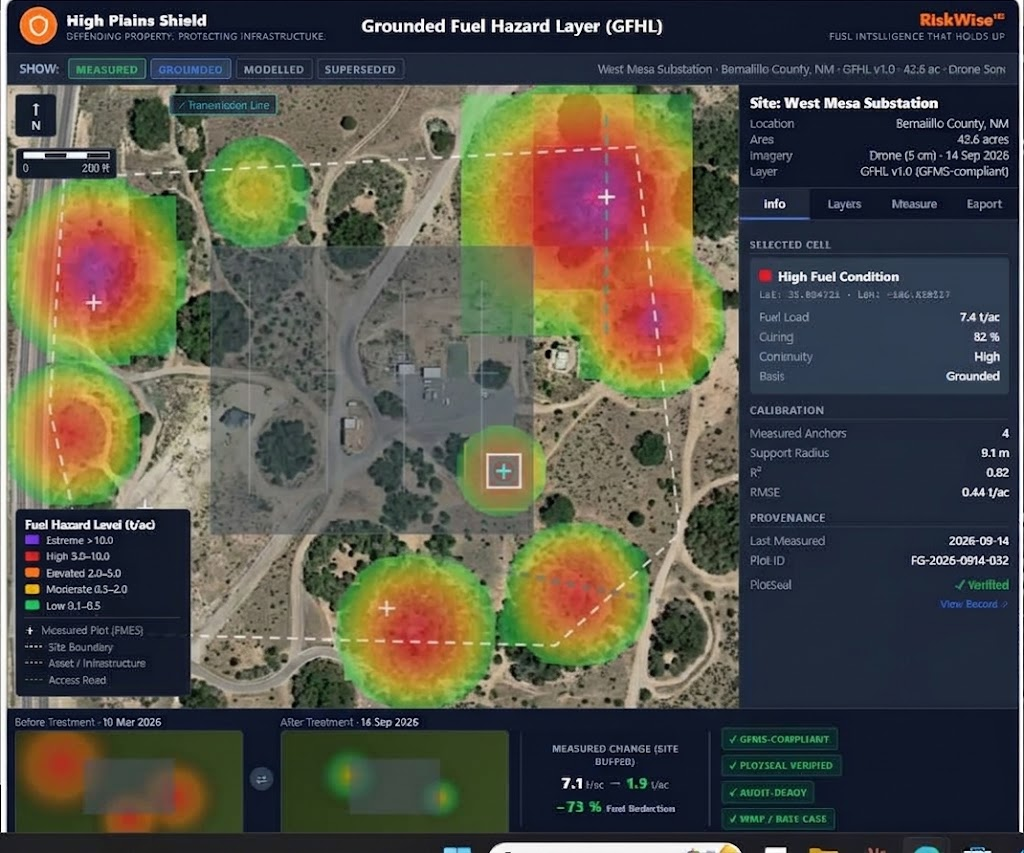
GFHL viewer (of-record demo screenshot).
GFMS-1.0-C spatial layer — a measured fuel map, not a fire-behavior model. The interactive demo below is labeled as demo.
GFHL viewer (of-record demo screenshot).
GFHL (Grounded Fuel Hazard Layer) is the plot-level measured hazard visualization defined under GFMS-1.0-C. It shows what was measured on the ground — anchored to Field Gauge plots — so operations and reporting share one spatial fuel picture.
Illustrative site visualization — not a live national coverage map. Toggle before / after / sealed states and click cells for plot detail.
Click any cell on the grid to inspect its field measurement, treatment record, and PlotSeal™ seal data.
The Grounded Fuel Hazard Layer is the plot-level measurement record that sits at the center of the CFI™ standard. It is called "grounded" because the data is anchored to a field measurement — not a fuel model, not a satellite estimate, not an industry average applied to a land-cover classification.
Each cell in the visualization above represents one treatment plot: a defined area where a qualified field technician recorded fuel load before treatment, applied retardant and measured coverage at application, and sealed the resulting record in PlotSeal™.
In a full engagement, Before / After / sealed views are the same measurement chain at different points — the interactive grid below is a labeled demo of that idea. The before fuel load anchors the treatment design. The after measurement confirms conformance. The PlotSeal™ seal makes the record independently verifiable.
That chain — measure, treat, measure, seal — is what CFI™ defines. GFHL is what it looks like.
Fuel load quantified at the plot level by a field technician. No extrapolation. No remote sensing substituting for on-the-ground data. The GFHL before state is this measurement.
Every post-treatment measurement is submitted to PlotSeal™, hashed, timestamped, and written to an immutable vault. The record cannot be edited after sealing. The GFHL after state reflects what was measured and sealed.
When a record is sealed, integrity can be checked against the hash. The PlotSeal™ Verified demo state illustrates which cells would carry a sealed record in a real engagement.
Sealed records are designed to be shared under operator-controlled grants — with insurers, auditors, regulators, counterparties, and boards.